Serbia’s Real Sector Performance

Export diversification

Diversification shows the degree to which an industry achieves expansive and far-reaching export competitiveness. Industries with a relatively high degree of diversification evidently possess the necessary capabilities to produce a variety of products that are demanded in a variety of markets. In this sense, the industry shows the ability to accommodate different customer needs, values, and cultures. Diversification deals with both product diversification and market diversification. An industry’s level of diversification from both perspectives reveals the degree to which an industry’s competitiveness is comprehensive. Product diversification is the level of product variety in the export basket of the industry, while market diversification deals with the number of foreign markets to which the industry exports. In other words, it reveals whether the industry possesses the necessary capabilities to produce a variety of products that are demanded in a variety of markets.

The best performing industries in terms of export diversity are those that produce and sell a great number of competitive products on a wide range of foreign markets. The leading industries identified by the diversification analysis are Manufacture of Prepared Meals and Animal Feed, Manufacture of Agrochemical Products, Manufacture of Furniture, etc. the least diversified industries are Manufacture and distribution of gas, steam and air conditioning, Mining of coal and lignite, Manufacture of bakery and farinaceous products and Mining of metal ores. They did not exhibit capacity to diversify they export both in terms of product and foreign market destinations. Industries are scattered by the number of the markets where they exhibited competitive advantage (on the vertical y-axis), and by the share of competitive’ products exports in the total value of the industry’s exports (horizontal x-axis). The vertical and horizontal lines intersecting the figure indicate the averages corresponding to each indicator. In this way, industries are classified into four quadrants by the number of markets where their market share was improved, and by the level of the product’s participation in such improvement.

Graph – Export diversification of industries (2009-2013)

Export dynamics

Analysis of export dynamics reveals if an industry possess the potential to improve its export position. According to Porter (1990), competitive advantage is the ability of an industry to innovate and upgrade in order to maintain its competitive export position. An industry must continually transform its “given” capabilities into advantages in order to remain competitive. Analysis of export dynamics reveals existence of industries’ competitive advantage through evaluation of export trends in a certain period and indicates if an industry’s export position has improved or deteriorated by evaluating export trends over time. As in the exports volume, export dynamics are evaluated from two perspectives. On the one hand, we compare industry growth rates within Serbia, identifying those industries with the highest rate of export growth in the economy. On the other hand, we compare export growth rates globally, distinguishing between industries with the capacity for further improvement of their position in foreign markets.

The most dynamic industries were able to grow faster than competitors from other countries, which enabled them to obtain a larger piece of market cake. The most dynamic industries were able to grow faster than competitors from other countries, which enabled them to obtain a larger piece of market cake. The leading industry is Manufacture of Electrical Equipment, which exhibited the highest competitiveness effect (20% of total industries). That industry is followed by Manufacture of coke and refined petroleum products, Mining of metal ores, etc. Industry that achieved by far the largest loss in competitiveness is Manufacture of Iron and Steel.

Graph below depicts the dispersion of industries according to their export growth rate and the contribution of CE to the export growth of industries. The higher the contribution of CE to the export growth rate, the greater the improvement of an industry’s competitiveness and therefore, the better is that industry’s export position. The yellow vertical line represents the growth rate of the total volume of world trade. Industries to the right of that line are exhibiting higher growth than the global trade trend, while the opposite is the case with industries lying to the left.

Graph – Export growth rates vs. Contribution of CE to export growth (2009-2013)

Case Study – Fabricated Metal Products

CEVES has identified 18 industries in the Serbian economy that, in spite of general obstacles in the business environment, insufficient macroeconomic stability, and a lack of financial resources, posses potential to foster further economic growth. Those industries exhibit strong export competitiveness and growth capabilities and can be considered the most promising, the most suitable and the most attractive industries for firm development. The main goal of this case study is to provide a sound knowledge about the performance and competitiveness of one selected industry, and to determine the reasons explaining that performance and competitiveness, by focusing on the identification and understanding of critical success factors. Considering the industry selection criteria (more in report, page 119), the manufacture of Fabricated Metal Products (FMP) was selected.

The Fabricated Metal Products (FMP) industry involves the transformation of metals into intermediate and final products using one or a combination of three processes – fabrication, preparation, and finishing – that can also encompass a host of other techniques such as forging, stamping, bending, forming, welding, machining and assembly. Companies in the sector purchase raw ferrous and nonferrous metals (e.g. carbon, aluminium, steel, titanium, brass, copper), generally the primary inputs in fabricated metal production, in either raw or semi-finished directly form primary producers or large-scale distribution companies and sell them to a range of industrial customers. Generally, this industry consists of a relatively large number of small and medium enterprises, with a relatively high share of exporters among them. The Fabricated Metal Sector had the highest number of companies of all sectors in the first quadrant and a HHI of only 150. Furthermore, the industry exhibited an improvement in export competitiveness, but with a high potential for further enhancement. The Fabricated Metal Products sector is located in the first quadrant and ranks 13th in terms of competitiveness and 15th in terms of industry performance out of 53 tradable industries.

The Industry of Fabricated Metal Products is one of the best performing industries in the Serbian economy, possessing adequate attributes and resources for firms to produce internationally competitive products while operating relatively sustainably and dynamically. The main characteristics, which determine the position of this industry in the performance-competitiveness matrix, are a great number of firms, a relatively solid overall performance and strong international competitiveness. The FMP industry is located in the first quadrant of the performance-competitiveness matrix, which indicates that this industry has achieved both positive export competitiveness and overall performance in the five-year period, from the strike of the crisis in 2009 until 2013. This quadrant obviously represents the desirable and preferable location for every industry. Industries located in this quadrant can be considered the current stars of Serbia’s economy. The exact position of the FMP industry within the performance-competitiveness matrix is shown in the figure below. The FMP industry is presented by an orange bubble, whose size is determined by the number of firms that operate in that industry. Other best performing industries, located in the first quadrant, are colored blue, while the remaining industries of the Serbian economy are colored grey.

Case study – Fabricated Metal Products

Graph – Industry overall performance and export competitiveness (2009-2013)

The Most Promising Industries

The main goal of our research is to shed a light on the most promising industries, with a potential to drive sustainable growth and development of Serbia’s economy through enhanced international competitiveness and exporting activities. The most promising industries in Serbia are those that possess adequate attributes and provide resources to firms in order for them to produce internationally competitive products while operating profitably, productively and dynamically. Those industries are capable of enhancing their growth, creating profits for company owners, generating employment, becoming even more competitive on global markets and therefore, significantly contributing to overall economic development of a country. Such industries can also be considered the most suitable for firm development. This does not mean that every firm in promising industries will be successful and internationally competitive. Rather, an average firm has greater chances of succeeding in such an industry. Whether a certain firm will succeed depends primarily on firm-level attributes.

Performance-competitiveness matrix, presented in the graph below, provides an overview and comparison of industries based on the characteristics and structure of international competitiveness and overall performance. It depicts the dispersion of 53 tradable industries according to their overall industry performance and their export competitiveness. Each industry is presented by a bubble, while the size of each bubble is determined by the number of firms within an industry. The more firms comprising an industry, the larger is the bubble representing that industry. Quadrant I is comprised of 18 promising industries, both internationally competitive and well performing. These industries have achieved both positive export competitiveness and overall performance in the five-year period, from the strike of the crisis in 2009 until 2013. Industries located in this quadrant can be considered the current stars of Serbia’s economy. Every third (18 out of 53) observed tradable industry is located in this quadrant, meaning that products of these industries were widely competitive on foreign markets, while the performance of these industries was relatively high.

Graph – Performance of industries (2009-2013)

Overall Industry Performance

The main goal of overall industry performance analysis is to provide a sound knowledge foundation about the systematic ability of firms, within an industry, to effectively achieve key business objectives in the observed post-crisis period (2009-2013). We define the key business goal as quick, inclusive, profitable and productive growth, which increases the welfare of the main stakeholders – owners, employees and state. This analysis complements previously conducted analysis of export competitiveness and provides additional information about the suitability of an industry for firm development. The main purpose of overall performance analysis is to provide a holistic picture about industries’ ability to drive sustainable and inclusive economic growth, by looking at their strength, dynamics, and structure. The overall industry performance analysis will enable an in-depth look at industries’ main characteristics, through measurement of key performance indicators (KPI), such as relative number of successful firms within an industry, overall demand trends, profitability, and productivity, and thereby supplement the picture of industries’ competitive capabilities.

Performance has two main components: extent of growth and quality of growth. These components are derived from our definition of performance, which indicates that it is important for businesses to grow and expand quickly, but that it is also necessary for businesses to establish a long-term and vital basis for that growth. Quality of growth further decomposes to comprehensiveness, sustainability, profitability and productivity.

Extent of growth – the dynamism of an industry
Comprehensiveness of industry development
Profitability of industry
Productivity of industry

Exports Competitiveness

Policymakers in Serbia must adapt a proactive approach to re-igniting economic growth by focusing on increasing exports. It appears quite clear that the country can no longer rely on demand-led growth to drive economic development. Not only are the inexpensive capital flows of the 1990s and most of the 2000s unlikely to return, but the Serbian economy simply does not generate enough demand in its small, relatively saturated market to sustain long-term development. Companies and political leadership must look to foreign markets and exports to drive development. This report argues that Serbia should employ an Export-Led Growth (ELG) model as the foundation of its economic development strategy. This implies encouraging increased exports as the primary engine of wider economic growth. An ELG-based model can promote smart, sustainable, and inclusive economic growth by promoting innovation and the production of goods and services with higher value added, fostering competitive exports which are more resilient to external shocks, and helping create more long-lasting employment for more marginalized groups in Serbian society.

The goal of export performance analysis is to identify industries that possess the necessary resources and capabilities for strong, dynamic, diversified, and sustainable export operations. The export performance analysis will enable an in-depth look at industries’ main international characteristics, through measurement of key performance indicators (KPI), such as comparative and competitive advantages. This analysis will help us identify the industries that can outgrow competitors and penetrate foreign markets successfully due to the presence of particular advantages.

The graph below reveals which particular industries within these sectors are benefiting from that advantage and strengthening their significance in exporting, and which are not. Industries with competitive advantage, located in quadrants I and II, are identified as Export stars and Rising stars, respectively, according to their level of RCA. In the same manner, industries without competitive advantage (located in quadrants III and IV) are classified as Marginal industries and Falling stars, respectively (more in report, page 63).

Export dynamics
Export diversification

Graph – Distribution of industries according to both their comparative and competitive advantages (2009-2013)

Regional business profiles in Serbia

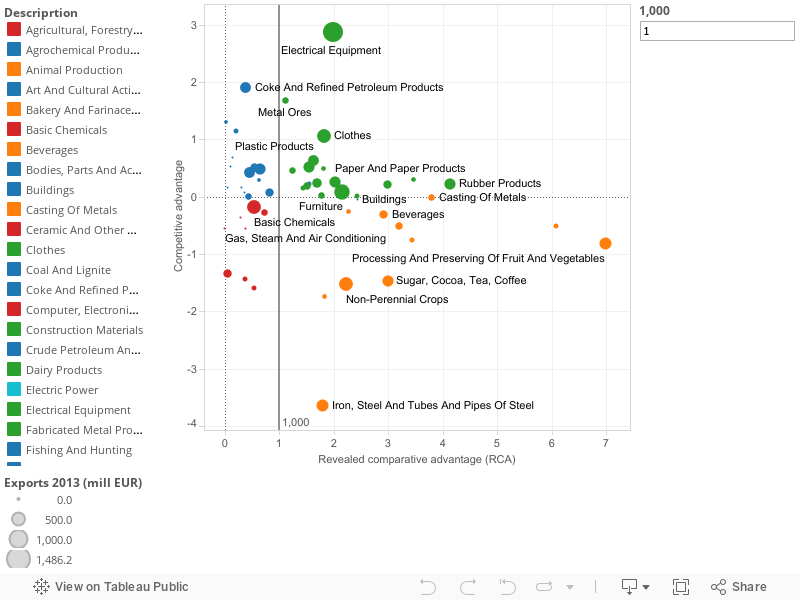
USAID Sustainable Local Development Project is active in 32 cities and municipalities in Serbia. The aim of one of the components of the Project is to strengthen businesses’ activities and to increase their comparative advantage in order to enhance the generation of income and to maximize product placement to the new, mostly foreign markets. Each of these municipalities have been supported in one particular industry the most relevant for this area. Business profiles show quick facts about these municipalities, such as the total population, number of formally employed, average wage, main industries and exports, etc.

The following cooperation between municipalities is established in eight general municipalities: IMC Subotica, IMC Novi Sad, IMC Zrenjanin, IMC Kraljevo, IMC Uzice, IMC Novi Pazar, IMC Nis and IMC Vranje.

1. IMC Subotica – IMC Subotica Business Profile

IMC Subotica covers municipalities of Subotica, Sombor and Kanjiza. USAID SLDP support is reflected in agriculture. Specifically, in equipping the laboratory of Public Health Institute in Subotica and Regional Educative Center in Sombor. The aim is to increase the comparative advantage and the capacity of agricultural producers. The result should be increased placement of fruits, vegetables and cereals to the domestic and foreign markets.

2. IMC Novi Sad – IMC Novi Sad Business Profile

IMC Novi Sad covers municipalities of Novi Sad, Beocin, Temerin and Sremski Karlovci. USAID SLDP support is reflected in metal industry and IT industry. The goal is strengthening and expanding the capacity of Vojvodina Metal Cluster (VMC) in order to increase exports of metal industry in 2014 and to increase the employment and business revenues in IT industry.

3. IMC Zrenjanin – IMC Zrenjanin Business Profile

IMC Zrenjanin covers municipalities of Zrenjanin, Kikinda and Novi Becej. USAID SLDP support is reflected in agriculture. This support includes the equipping the greenhouses with the main goal of educating young people and increasing the number of households that grow vegetables. The final result will be a new number of individual agricultural producers.

4. IMC Kraljevo – IMC Kraljevo Business Profile

IMC Kraljevo covers municipalities of Kraljevo, Cacak, Gornji Milanovac and Vrnjacka Banja. USAID SLDP support is in new innovations in SME sector. The aim is to strengthen the business of IMPuls center in Kraljevo and Science and Technology park in Cacak. The goal is to increase the number of firms that use services of IMPuls center.

5. IMC Uzice – IMC Uzice Business Profile

IMC Uzice covers municipalities of Uzice, Cajetina and Nova Varos. The project supported local manufacturers of agricultural products and those who provide services in tourism. USAID SLDP and Regional Development Agency Zlatibor try to increase the number of procurements from HORECA sector in the domestic market. The goal is that hotels and other hospitality businesses purchase more products and services from producers from these municipalities.

6. IMC Novi Pazar – IMC Novi Pazar Business Profile

IMC Novi Pazar covers municipalities of Novi Pazar, Sjenica and Tutin. The support is provided to the producers of jeans and footwear. Foreign experts give advices how to improve the process of manufacture and how to select more competitive products, how to improve marketing activities and find new markets in Serbia and abroad. Expected results should be an increase in business revenues, exports and employment. Also, the manufacture of furniture and processing of herbs and forest fruits is not so developed, but USAID’s predictions are that it has a lot of room for potential future growth.

7. IMC Nis – IMC Nis Business Profile

IMC Nis covers municipalities of Nis, Leskovac, Doljevac, Gadzin Han and Merosina. USAID supports IT and agricultural industry. The results should be a small increase in employment and business revenues in the sector of Informational technologies. The support in agriculture is reflected in assisting the Food Processing Support Center in Nis and Food and Technology Center in Leskovac. Expected results should be increased business revenues.

8. IMC Vranje – IMC Vranje Business Profile

IMC Vranje covers municipalities of Vranje, Bujanovac, Presevo and Vladicin Han. SLDP support is visible in manufacture of footwear through enhancing the competitiveness and openness to the new markets and also in realization of new investments in footwear industry in this region. Expected results should be increased business revenues (especially exports) of footwear industry as well as increased foreign direct investments in 2014 and 2015 in the industrial zone Bunusevac in Vranje.

Survey report – Key factors underlying the performance of enterprises in Serbia.

Survey report is a part of of Project “Serbia’s Real Sector Performance: Exhibited Competitiveness by Size, Industry and Region” funded by USAID Sustainable Local Development Project. The goal of this survey was to assess the key factors underlying the performance of enterprises in Serbia. It covers ten general topic areas of private sector operations in attempt to broadly identify and assess what firms do, how they are structured and run, whom they interact with and how, and what their expectations are for the future. In line with CEVES’ belief that exports must be the primary mechanism underpinning Serbia’s economic growth, the survey focuses only on tradable sectors. It also hones in relatively more on three areas CEVES considers to be particularly important determinants of company success or failure: corporate governance, financial management and access to finance, and exports.

In the realm of corporate governance, the survey revealed that company ownership and decision-making authority tend to be concentrated in few people. Around three quarters of companies only have one owner; moreover, single individuals tend to hold ownership stakes greater than 50% in businesses with multiple individuals in the ownership structure. 90% of companies are also family-owned. Owners are most often the only individuals involved in important operational decisions such as capital investments and taking on additional credit. They are also normally the only ones involved in the regular financial management of the company.

In terms of financing, most companies rely mainly on themselves and eschew financing from commercial banks, even in spite of evidence to suggest that businesses have reason for seeking credit. Most enterprises rely on only one source of financing – internal financing – which is also the most used source of financing in the vast majority of companies. Domestic bank loans were identified as one of the three most important sources of financing by 27% of companies. Even though over half of firms have used bank loans at some point, only around one third do so currently. Most indicated that they not need loans, but would reconsider if certain factors were to change. Given Serbian firms’ tendency innovate and invest (most did so even during the crisis), desire to expand operations (nearly two thirds stated a desire to develop their business in the future), and identification of financing as a problem (it was cited as the most common obstacle to expansion of operations), it would seem that there is indeed demand for increased access to finance.

Survey evidence broadly suggests that there is potential for Serbian companies to raise export performance. Nearly all of those that do not export (around three quarters of firms in tradable sector) note that they never have exported, and just under three quarters of non-exporters do not believe that they will begin doing so in the next year. It is then perhaps unsurprising that exports on average accounted for only 9% of company sales. Encouragingly, companies that do export tend to do so for continuous periods of time. Most cite the quality of their product as their main competitive edge on foreign markets, while firms most often pointed to trouble in finding appropriate buyers as the biggest obstacle to greater exports.

Survey Report

Productivity of industries

The productivity of the firm is determined by the efficient use of inputs in the production process. Productivity in this analysis is measured through labor productivity, which is calculated as the ratio between a firm’s or industry’s value added and its total number of employees. The productivity of Serbia’s economy was RSD 1.6 million per employee in 2013, which means that the average contribution of one worker to the value added of Serbia’s economy was around EUR 14.000. On the other hand, productivity of an average firm in Serbia’s economy was much lower, reaching only EUR 6.000 per employee. The already low level of productivity of Serbia’s economy is driven by a minority of industries and a few large systems within those industries. Only every third industry managed to operate more productively than Serbia’s economy. Low productivity is directly linked with low investment: FDI to Serbia is lower than in regional peers and about three quarters of FDI went to non-tradable sectors of the economy.

The graph below provides in-depth information about productivity level, characteristics and distribution within industries in Serbia’s economy. All industries fall solely in the first and fourth quadrants, revealing that no average firms exhibited negative productivity. Aggregate industry productivity of both the Air Transport and Manufacture of Iron and Steel (located in Quadrant IV) sectors was negative. This indicates that the value added of these two industries was also negative. Such extremely bad results of Air Transport and Iron and Steel were directly caused by the unsuccessful operations of two large state-owned enterprises that dominate these industries, Air Serbia and Zelezara Smederevo, respectively.

Graph – Productivity of industries (2009-2013)

Profitability of industries

Profitability primarily indicates to what extent a company is able to produce and sell its goods in the market place for a profit. Broadly, it is a reflection of how well a company renders a product and/or service and to what degree it is able to generate sales. The EBITDA margin in this analysis is used as an indicator of profitability. The EBITDA Margin of Serbia’s economy stood at a solid 8% in 2013 – eight cents of EBITDA was generated per euro of sales. Average firms were not able to track the economy’s trends dictated by larger profitable firms, due to lack of possibility of becoming more competitive, in terms of production costs, market power, visibility and other key competitiveness factors which create gaps between small and large businesses.

The graph below provides an in-depth look into the profitability of industries in Serbia’s economy. It depicts the dispersion of industries according to the profitability of their average firms and the profitability of industry as a whole. The profitability of a vast majority of industries in Serbia’s economy was determined by the earning power of one or few large firms within those industries. The most profitable industries in Serbia’s economy are those that have most effectively and efficiently produced and sold their goods in the market place and thereby systematically achieved remarkable core profitability rates. They are located in sub-quadrant I (above the horizontal green line and to the right of the vertical red line) and exhibit profit margins that are above both averages for the economy. In addition, these industries have the greatest potential to spur economic growth through continued and increased activity.

Graph – Profitability of industries (2009-2013)

Comprehensiveness of industry development

Comprehensiveness refers to the proportion of firms driving the growth of an industry. Growth should be as comprehensive as possible, i.e. supported by as many firms within the industry as possible. The greater the number of firms contributing to the growth of an industry, the more comprehensive is the growth of that industry. The comprehensiveness of industry growth is measured by the proportion of successful firms in a certain industry (more in report, page 72). Every fourth bona fide firm in Serbia’s economy was successful in the post-crisis period generating 45% of the economy’s total revenues. Of the successful firms, almost 40% of them can be considered fast-growing, with an increment of revenues above 20% annually. Every tenth bona fide firm in Serbia’s economy was both successful and fast-growing. Those 7,000 companies represent the real strength and healthy foundation of Serbia’s economy.

The graph below provides in-depth look into attractiveness, suitability and development of industries in Serbia’s economy. The best performing industries in terms of comprehensiveness are those with a high concentration of resilient and profitably growing firms, whose contribution to industry revenues was relatively significant. This is of course, the most desirable situation for any industry. Industries located in first sub-quadrant have some of the greatest potential to drive economic growth and development for the country as a whole.

Graph – Comprehensiveness of industry development (2009-2013)

Extent of growth – the dynamism of an industry

The extent of growth is the first component of overall industry performance and it refers to the dynamism of an industry – the degree to which an industry has expanded its activities and operations in the observed period. Serbia’s economy has increased its revenues from 2009 to 2013, seemingly recovering from the strike of the crisis. However, a minority of industries drove this growth. Serbia’s economy grew 5.5% in the observed post-crisis period. However, only a third of the country’s industries exhibited higher growth than the economy’s average of 5.5%, while the rest remained below average.

This graph presents the distribution of all industries, scattered by the growth of both the average firm within industry and the industry as a whole. This figure presents the distribution of all industries, scattered by the growth of both the average firm within industry and the industry as a whole. The dynamics of a vast majority of industries in Serbia’s economy were determined by the growth of one or few large firms within those industries. 25% of industries managed to recover from the strike of the crisis and achieved comprehensive growth in the five year period; overall demand for the industry’s products grew, while the revenues of average firms increased as well. The best performing industries, in terms of extent of growth, are those which have experienced systematic and relatively dynamic growth of business operations. These industries are located in the first quadrant and lie above the horizontal red line.

Graph – Extent of the Growth (2009-2013)