Overall Industry Performance

Productivity of industries

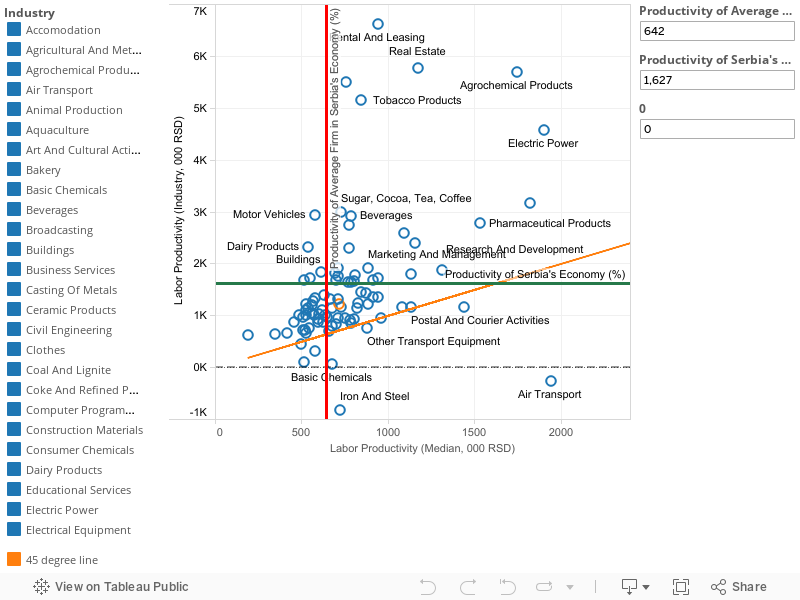
The productivity of the firm is determined by the efficient use of inputs in the production process. Productivity in this analysis is measured through labor productivity, which is calculated as the ratio between a firm’s or industry’s value added and its total number of employees. The productivity of Serbia’s economy was RSD 1.6 million per employee in 2013, which means that the average contribution of one worker to the value added of Serbia’s economy was around EUR 14.000. On the other hand, productivity of an average firm in Serbia’s economy was much lower, reaching only EUR 6.000 per employee. The already low level of productivity of Serbia’s economy is driven by a minority of industries and a few large systems within those industries. Only every third industry managed to operate more productively than Serbia’s economy. Low productivity is directly linked with low investment: FDI to Serbia is lower than in regional peers and about three quarters of FDI went to non-tradable sectors of the economy.

The graph below provides in-depth information about productivity level, characteristics and distribution within industries in Serbia’s economy. All industries fall solely in the first and fourth quadrants, revealing that no average firms exhibited negative productivity. Aggregate industry productivity of both the Air Transport and Manufacture of Iron and Steel (located in Quadrant IV) sectors was negative. This indicates that the value added of these two industries was also negative. Such extremely bad results of Air Transport and Iron and Steel were directly caused by the unsuccessful operations of two large state-owned enterprises that dominate these industries, Air Serbia and Zelezara Smederevo, respectively.

Graph – Productivity of industries (2009-2013)

Profitability of industries

Profitability primarily indicates to what extent a company is able to produce and sell its goods in the market place for a profit. Broadly, it is a reflection of how well a company renders a product and/or service and to what degree it is able to generate sales. The EBITDA margin in this analysis is used as an indicator of profitability. The EBITDA Margin of Serbia’s economy stood at a solid 8% in 2013 – eight cents of EBITDA was generated per euro of sales. Average firms were not able to track the economy’s trends dictated by larger profitable firms, due to lack of possibility of becoming more competitive, in terms of production costs, market power, visibility and other key competitiveness factors which create gaps between small and large businesses.

The graph below provides an in-depth look into the profitability of industries in Serbia’s economy. It depicts the dispersion of industries according to the profitability of their average firms and the profitability of industry as a whole. The profitability of a vast majority of industries in Serbia’s economy was determined by the earning power of one or few large firms within those industries. The most profitable industries in Serbia’s economy are those that have most effectively and efficiently produced and sold their goods in the market place and thereby systematically achieved remarkable core profitability rates. They are located in sub-quadrant I (above the horizontal green line and to the right of the vertical red line) and exhibit profit margins that are above both averages for the economy. In addition, these industries have the greatest potential to spur economic growth through continued and increased activity.

Graph – Profitability of industries (2009-2013)

Comprehensiveness of industry development

Comprehensiveness refers to the proportion of firms driving the growth of an industry. Growth should be as comprehensive as possible, i.e. supported by as many firms within the industry as possible. The greater the number of firms contributing to the growth of an industry, the more comprehensive is the growth of that industry. The comprehensiveness of industry growth is measured by the proportion of successful firms in a certain industry (more in report, page 72). Every fourth bona fide firm in Serbia’s economy was successful in the post-crisis period generating 45% of the economy’s total revenues. Of the successful firms, almost 40% of them can be considered fast-growing, with an increment of revenues above 20% annually. Every tenth bona fide firm in Serbia’s economy was both successful and fast-growing. Those 7,000 companies represent the real strength and healthy foundation of Serbia’s economy.

The graph below provides in-depth look into attractiveness, suitability and development of industries in Serbia’s economy. The best performing industries in terms of comprehensiveness are those with a high concentration of resilient and profitably growing firms, whose contribution to industry revenues was relatively significant. This is of course, the most desirable situation for any industry. Industries located in first sub-quadrant have some of the greatest potential to drive economic growth and development for the country as a whole.

Graph – Comprehensiveness of industry development (2009-2013)

Extent of growth – the dynamism of an industry

The extent of growth is the first component of overall industry performance and it refers to the dynamism of an industry – the degree to which an industry has expanded its activities and operations in the observed period. Serbia’s economy has increased its revenues from 2009 to 2013, seemingly recovering from the strike of the crisis. However, a minority of industries drove this growth. Serbia’s economy grew 5.5% in the observed post-crisis period. However, only a third of the country’s industries exhibited higher growth than the economy’s average of 5.5%, while the rest remained below average.

This graph presents the distribution of all industries, scattered by the growth of both the average firm within industry and the industry as a whole. This figure presents the distribution of all industries, scattered by the growth of both the average firm within industry and the industry as a whole. The dynamics of a vast majority of industries in Serbia’s economy were determined by the growth of one or few large firms within those industries. 25% of industries managed to recover from the strike of the crisis and achieved comprehensive growth in the five year period; overall demand for the industry’s products grew, while the revenues of average firms increased as well. The best performing industries, in terms of extent of growth, are those which have experienced systematic and relatively dynamic growth of business operations. These industries are located in the first quadrant and lie above the horizontal red line.

Graph – Extent of the Growth (2009-2013)