
Analysis of export dynamics reveals if an industry possesses the potential to improve its export position. According to Porter (1990), competitive advantage is the ability of an industry to innovate and upgrade in order to maintain its competitive export position. An industry must continually transform its “given” capabilities into advantages in order to remain competitive. Analysis of export dynamics reveals the existence of industries’ competitive advantage through the evaluation of export trends in a certain period and indicates if an industry’s export position has improved or deteriorated by evaluating export trends over time. As with export volume, export dynamics are evaluated from two perspectives. On the one hand, we compare industry growth rates within Serbia, identifying those industries with the highest rate of export growth in the economy. On the other hand, we compare export growth rates globally, distinguishing between industries with the capacity for further improvement of their position in foreign markets.
The most dynamic industries were able to grow faster than competitors from other countries, which enabled them to obtain a larger piece of the market cake. The most dynamic industries were able to grow faster than competitors from other countries, which enabled them to obtain a larger piece of the market cake. The leading industry is the Manufacture of Electrical Equipment, which exhibited the highest competitiveness effect (201% of total industries). That industry is followed by the Manufacture of coke and refined petroleum products, Mining of metal ores, etc. The industry that achieved by far the largest loss in competitiveness is the Manufacture of Iron and Steel.
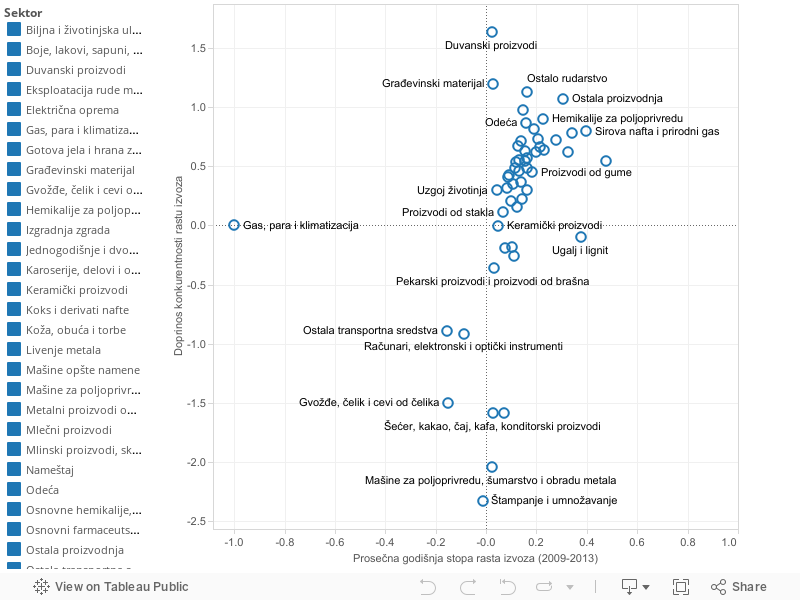
The graph below depicts the dispersion of industries according to their export growth rate and the contribution of CE to the export growth of industries. The higher the contribution of CE to the export growth rate, the greater the improvement of an industry’s competitiveness and therefore, the better is that industry’s export position. The yellow vertical line represents the growth rate of the total volume of world trade. Industries to the right of that line are exhibiting higher growth than the global trade trend, while the opposite is the case with industries lying to the left.
Graph – Export growth rates vs. Contribution of CE to export growth (2009-2013)
Analysis of export dynamics reveals if an industry possess the potential to improve its export position. Porter (1990) defines competitive advantage as the ability of an industry to constantly innovate and improve its operations in order to maintain its competitive export position. To remain competitive, an industry must continuously transform its „given“ potentials into advantages. Analysis of export dynamics reveals the existence of competitive advantage through the evaluation of export trends in a certain period. In the previous section, we analyzed the volume of exports, thus arriving at the level of comparative advantage, which is interpreted as a critical mass of resources and capacities leading to satisfactory export performance. However, this analysis does not take into account changes that occur over time. On the other hand, export dynamics indicate whether a company's export position has improved or deteriorated, by evaluating changes in export trends over time.
The most dynamic industries were able to grow faster than competitors from other countries, which enabled them to obtain a larger piece of the market „cake“. The leading industry in this regard is the manufacture of electrical equipment, where we record the largest share of the competitiveness effect (20%) compared to other industries. This is followed by the manufacture of coke and petroleum derivatives, mining of metal ores, etc. The industry that achieved by far the largest decline in competitiveness is the manufacture of pig iron and steel.
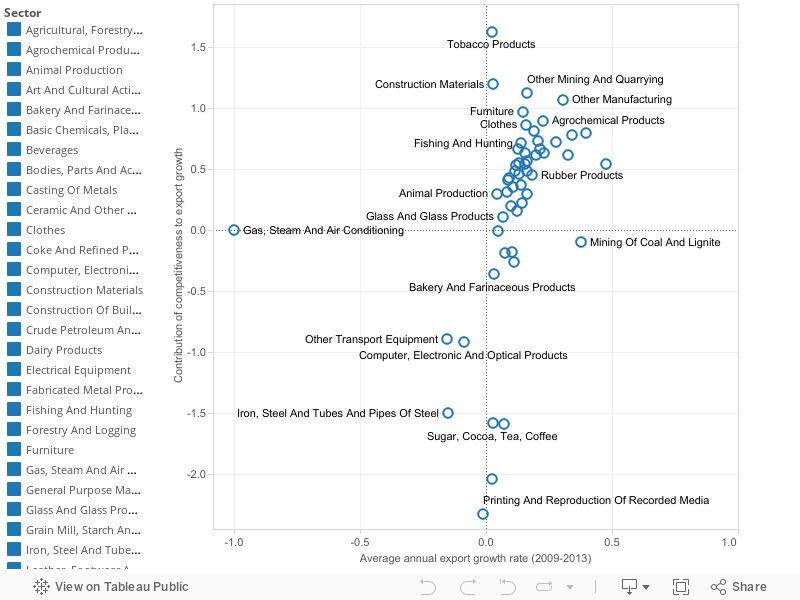
The graph below shows the distribution of industries according to their export growth rate and the contribution of the competitiveness effect to export growth. The higher the contribution of the competitiveness effect to the export growth rate, the greater the improvement in the competitiveness of the observed industry, and therefore, its export position is more favorable. The yellow vertical line represents the growth rate of world trade as a whole. Industries located to the right of this line show higher growth than the world trade growth trend, while the opposite is the case with industries located to its left.
Graph – Export growth rate vs. Contribution of CE to export growth (2009-2013)