The extent of growth is the first component of overall industry performance and it refers to the dynamism of an industry – the degree to which an industry has expanded its activities and operations in the observed period. Serbia’s economy has increased its revenues from 2009 to 2013, seemingly recovering from the strike of the crisis. However, a minority of industries drove this growth. Serbia’s economy grew 5.5% in the observed post-crisis period. However, only a third of the country’s industries exhibited higher growth than the economy’s average of 5.5%, while the rest remained below average.
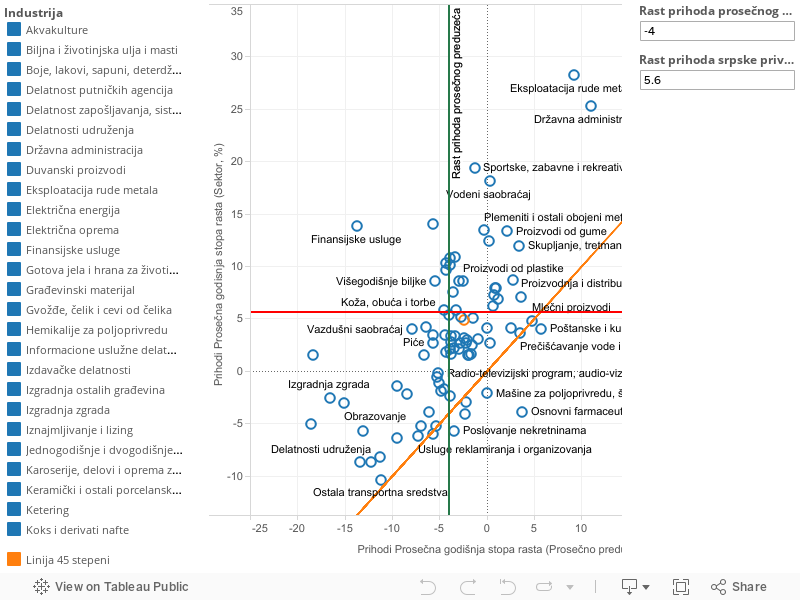
This graph presents the distribution of all industries, scattered by the growth of both the average firm within industry and the industry as a whole. This figure presents the distribution of all industries, scattered by the growth of both the average firm within industry and the industry as a whole. The dynamics of a vast majority of industries in Serbia’s economy were determined by the growth of one or few large firms within those industries. 25% of industries managed to recover from the strike of the crisis and achieved comprehensive growth in the five year period; overall demand for the industry’s products grew, while the revenues of average firms increased as well. The best performing industries, in terms of extent of growth, are those which have experienced systematic and relatively dynamic growth of business operations. These industries are located in the first quadrant and lie above the horizontal red line.
Graph – Extent of the Growth (2009-2013)
The extent of growth is the first component of industry performance, and refers to the dynamism of an industry – the measure to which an industry has expanded the scope of its activities and operations in the observed period. In the Serbian economy, revenues increased from 2009 to 2013, and it seems to be on the path to recovery from the crisis. However, this growth was based on the results of only a small number of industries. The Serbian economy grew at a rate of 5.5% during the observed post-crisis period. However, only one third of industries showed growth at a rate higher than the average of 5.5%, while the rest remained below average.
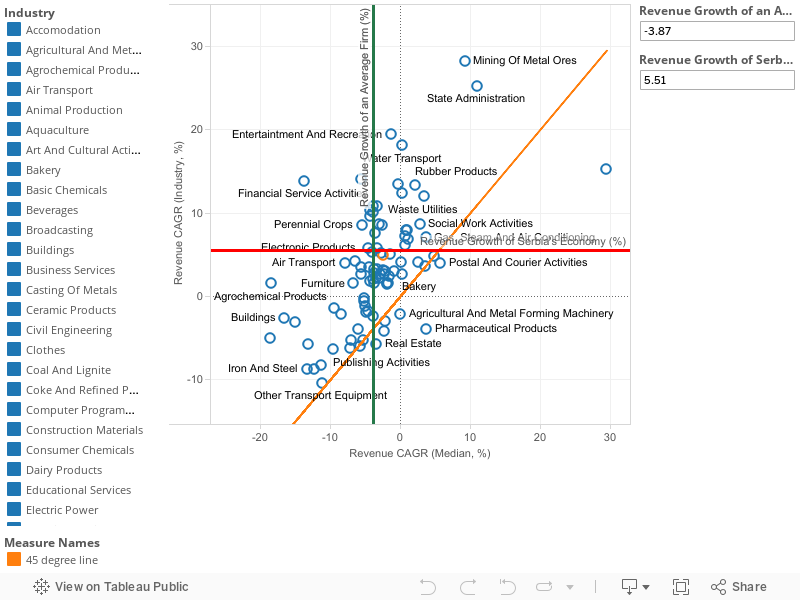
This graph allows us to gain deeper insight into the characteristics, structure, and sources of growth of the industries that make up the Serbian economy. The graph shows the distribution of all industries, according to the growth rate of the average firm operating in each industry and the growth rate of the industry itself. The dynamism of the vast majority of industries in Serbia is determined by the growth of one large firm operating in that industry or a smaller number of such firms. A total of 25% of industries managed to recover from the impact of the crisis and achieve comprehensive development in the observed five-year period. Overall demand for the products of these industries increased, while the revenues of average firms operating in them also increased. Viewed in terms of the extent of growth, the best performing industries are those that have achieved systematic and relatively dynamic business growth. These industries are located in the first quadrant in our graphical representation, and above the horizontal red line.
Graph – Extent of Growth (2009-2013)