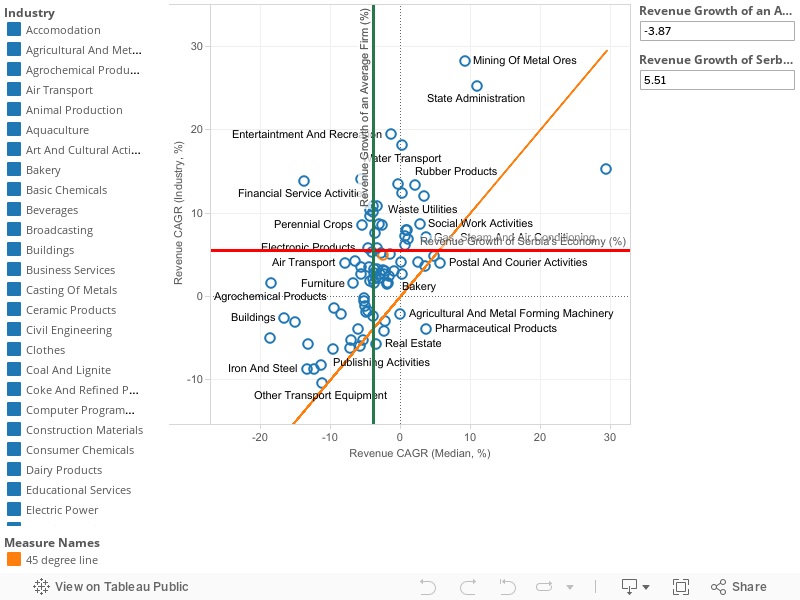
The extent of growth is the first component of overall industry performance and it refers to the dynamism of an industry – the degree to which an industry has expanded its activities and operations in the observed period. Serbia’s economy has increased its revenues from 2009 to 2013, seemingly recovering from the strike of the crisis. However, a minority of industries drove this growth. Serbia’s economy grew 5.5% in the observed post-crisis period. However, only a third of the country’s industries exhibited higher growth than the economy’s average of 5.5%, while the rest remained below average.
This graph presents the distribution of all industries, scattered by the growth of both the average firm within industry and the industry as a whole. This figure presents the distribution of all industries, scattered by the growth of both the average firm within industry and the industry as a whole. The dynamics of a vast majority of industries in Serbia’s economy were determined by the growth of one or few large firms within those industries. 25% of industries managed to recover from the strike of the crisis and achieved comprehensive growth in the five year period; overall demand for the industry’s products grew, while the revenues of average firms increased as well. The best performing industries, in terms of extent of growth, are those which have experienced systematic and relatively dynamic growth of business operations. These industries are located in the first quadrant and lie above the horizontal red line.
Graph – Extent of the Growth (2009-2013)
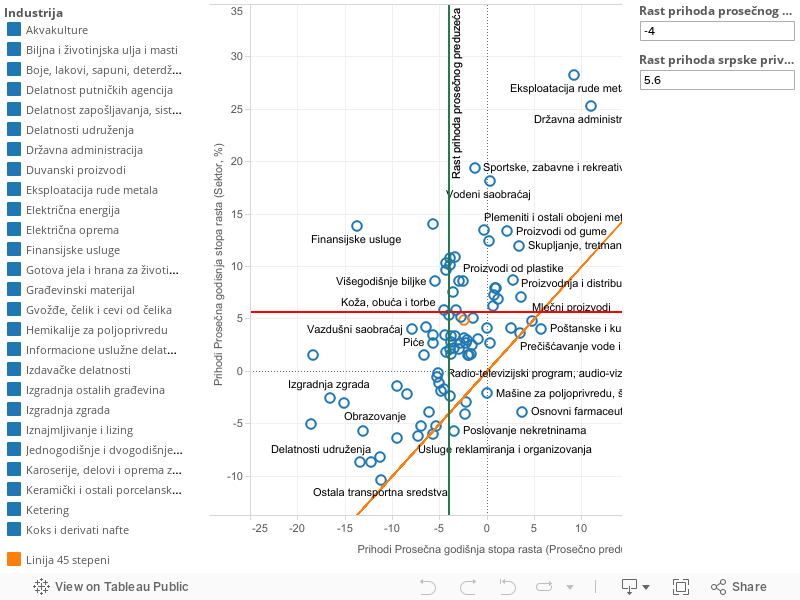
Obim rasta je prva komponenta performanse sektora, i odnosi se na dinamičnost jednog sektora – meru u kojoj je jedan sektor proširio obim svojih aktivnosti i poslovanja u posmatranom periodu. U srpskoj privredi je od 2009. do 2013. došlo do povećanja prihoda, i čini se da je ona na putu oporavka od krize. Međutim, ovaj rast se zasnivao na rezultatima tek manjeg broj sektora. Privreda Srbije rasla je po stopi od 5,5% tokom posmatranog postkriznog perioda. Međutim, tek jedna trećina sektora iskazala je rast po stopi većoj od prosečnih 5,5%, dok su ostali i dalje bili ispod proseka.
Ovaj grafik nam omogućava da ostvarimo dublji uvid u karakteristike, strukturu i izvore rasta sektora koji čine srpsku privredu. Na grafiku je prikazana distribucija svih sektora, i to prema stopi rasta prosečne firme koja posluje u svakom sektoru i stopi rasta samog sektora. Dinamičnost ogromne većine sektora u Srbiji određena je rastom jedne velike firme koja posluje u tom sektoru ili manjeg broja takvih firmi. Ukupno 25% sektora uspelo je da se oporavi od udara krize i ostvari sveobuhvatan razvoj u posmatranom petogodišnjem periodu. Ukupna tražnja za proizvodima tih sektora porasla je, dok su se povećali i prihodi prosečnih firmi koje posluju u njima. Posmatrano prema obimu rasta, sektori sa najboljom performansom su oni koji su ostvarili sistematski i relativno dinamičan rast poslovanja. Ti se sektori na našem grafičkom prikazu nalaze u prvom kvadrantu, i to iznad horizontalne crvene linije.
Grafik – Obim rasta (2009-2013)