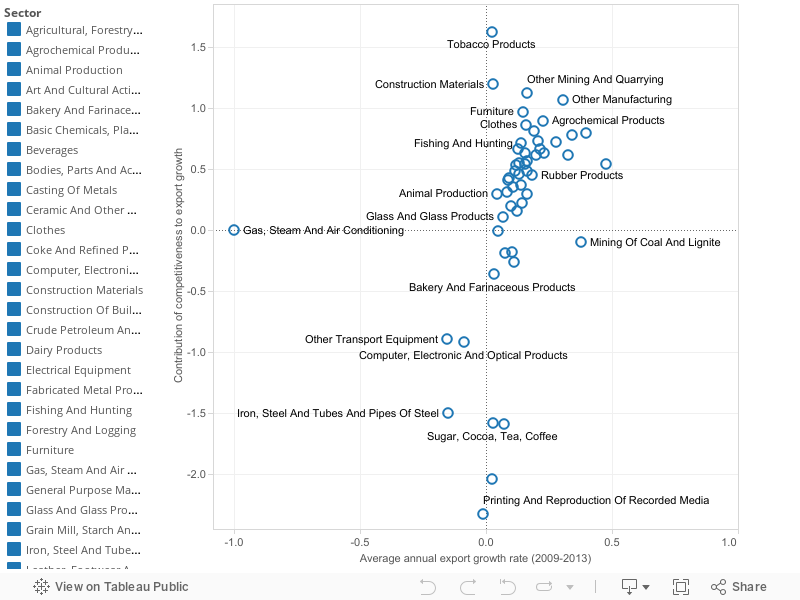
Analysis of export dynamics reveals if an industry possess the potential to improve its export position. According to Porter (1990), competitive advantage is the ability of an industry to innovate and upgrade in order to maintain its competitive export position. An industry must continually transform its “given” capabilities into advantages in order to remain competitive. Analysis of export dynamics reveals existence of industries’ competitive advantage through evaluation of export trends in a certain period and indicates if an industry’s export position has improved or deteriorated by evaluating export trends over time. As in the exports volume, export dynamics are evaluated from two perspectives. On the one hand, we compare industry growth rates within Serbia, identifying those industries with the highest rate of export growth in the economy. On the other hand, we compare export growth rates globally, distinguishing between industries with the capacity for further improvement of their position in foreign markets.
The most dynamic industries were able to grow faster than competitors from other countries, which enabled them to obtain a larger piece of market cake. The most dynamic industries were able to grow faster than competitors from other countries, which enabled them to obtain a larger piece of market cake. The leading industry is Manufacture of Electrical Equipment, which exhibited the highest competitiveness effect (20% of total industries). That industry is followed by Manufacture of coke and refined petroleum products, Mining of metal ores, etc. Industry that achieved by far the largest loss in competitiveness is Manufacture of Iron and Steel.
Graph below depicts the dispersion of industries according to their export growth rate and the contribution of CE to the export growth of industries. The higher the contribution of CE to the export growth rate, the greater the improvement of an industry’s competitiveness and therefore, the better is that industry’s export position. The yellow vertical line represents the growth rate of the total volume of world trade. Industries to the right of that line are exhibiting higher growth than the global trade trend, while the opposite is the case with industries lying to the left.
Graph – Export growth rates vs. Contribution of CE to export growth (2009-2013)
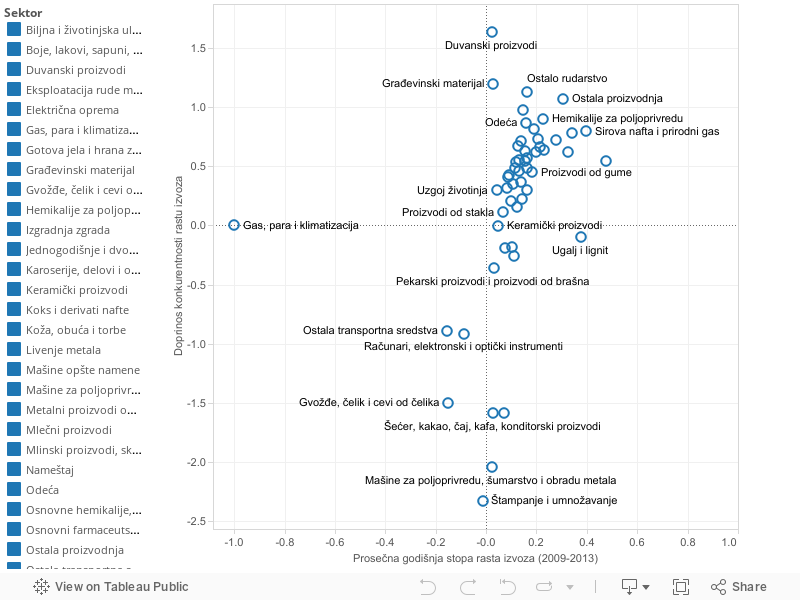
Analiza dinamičnosti izvoza pruža uvid u to da li jedan sektor ima potencijal da unapredi svoj izvozni položaj. Porter (1990) definiše konkurentnu prednost kao sposobnost jednog sektora da stalno unosi inovacije i unapređuje svoj rad kako bi zadržao svoj konkurentan izvozni položaj. Da bi ostao konkurentan, jedan sektor mora svoje „zadate“ potencijale neprekidno da pretvara u prednosti. Analizom dinamičnosti izvoza otkriva se postojanje konkurentne prednosti kroz evaluaciju izvoznih trendova u određenom periodu. U prethodnom odeljku smo analizirali obim izvoza i time došli do nivoa komparativne prednosti koji se tumači kao kritična masa resursa i kapaciteta koji dovode do zadovoljavajuće izvozne performanse. Međutim, ovom analizom se u obzir ne uzimaju promene koje se dešavaju sa protokom vremena. Sa druge strane, dinamičnost izvoza ukazuje na to da li se izvozna pozicija jedne firme poboljšala ili pogoršala, i to kroz evaluaciju promena u kretanju izvoza sa protokom vremena.
Najdinamičniji sektori u stanju su da se razvijaju brže od konkurencije iz drugih zemalja, što im omogućava da zadobiju veći deo tržišnog „kolača“. Vodeći sektor u tom pogledu je proizvodnja električne opreme, kod koje beležimo najveće učešće efekta konkurentnosti (20%) u poređenju sa ostalim sektorima. Potom slede proizvodnja koksa i derivata nafte, eksploatacija ruda metala, itd. Sektor koji je ostvario daleko najveći pad konkurentnosti je proizvodnja sirovog gvožđa i čelika.
Na grafiku ispod prikazujemo distribuciju sektora prema stopi rasta izvoza i doprinosu efekta konkurentnosti rastu izvoza. Što je veći doprinos efekta konkurentnosti stopi rasta izvoza, to je veće i poboljšanje konkurentnosti posmatranog sektora, a samim tim je i njegova izvozna pozicija povoljnija. Žutom vertikalnom linijom predstavljena je stopa rasta svetske trgovinske razmene u celini.Sektori smešteni sa desne strane te linije iskazuju veći razvoj od trenda rasta svetske trgovinske razmene, dok je suprotan slučaj sa sektorima koji se nalaze sa njene leve strane.
Grafik – Odnos stopa rasta izvoza i doprinosa CE rastu izvoza (2009-2013)