The main goal of our research is to shed a light on the most promising industries, with a potential to drive sustainable growth and development of Serbia’s economy through enhanced international competitiveness and exporting activities. The most promising industries in Serbia are those that possess adequate attributes and provide resources to firms in order for them to produce internationally competitive products while operating profitably, productively and dynamically. Those industries are capable of enhancing their growth, creating profits for company owners, generating employment, becoming even more competitive on global markets and therefore, significantly contributing to overall economic development of a country. Such industries can also be considered the most suitable for firm development. This does not mean that every firm in promising industries will be successful and internationally competitive. Rather, an average firm has greater chances of succeeding in such an industry. Whether a certain firm will succeed depends primarily on firm-level attributes.
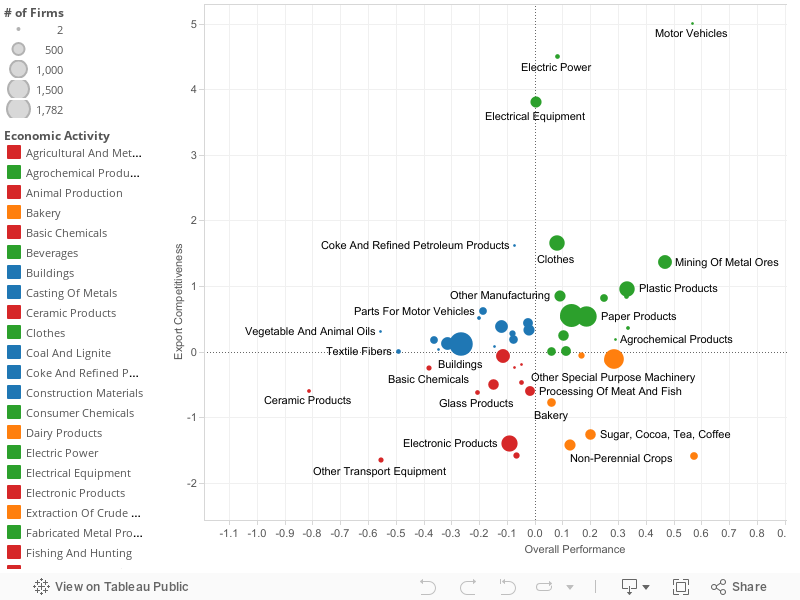
Performance-competitiveness matrix, presented in the graph below, provides an overview and comparison of industries based on the characteristics and structure of international competitiveness and overall performance. It depicts the dispersion of 53 tradable industries according to their overall industry performance and their export competitiveness. Each industry is presented by a bubble, while the size of each bubble is determined by the number of firms within an industry. The more firms comprising an industry, the larger is the bubble representing that industry. Quadrant I is comprised of 18 promising industries, both internationally competitive and well performing. These industries have achieved both positive export competitiveness and overall performance in the five-year period, from the strike of the crisis in 2009 until 2013. Industries located in this quadrant can be considered the current stars of Serbia’s economy. Every third (18 out of 53) observed tradable industry is located in this quadrant, meaning that products of these industries were widely competitive on foreign markets, while the performance of these industries was relatively high.
Graph – Performance of industries (2009-2013)
Osnovni cilj našeg istraživanja jeste da se ukaže na sektore sa najvećim potencijalom, one koji imaju mogućnost da pokrenu održivi rast i razvoj privrede Srbije kroz unapređenje konkurentnosti na inostranim tržištima. Sektori sa najvećim potencijalom u Srbiji su oni koji firmama pružaju resurse uz koje su one u stanju da proizvode međunarodno konkurentne proizvode dok im je poslovanje istovremeno profitabilno, produktivno i dinamično. Ti sektori su u stanju da povećaju rast, stvore dobit za vlasnike firmi, stvore nova radna mesta, pri tome postajući konkurentniji na globalnom nivou čime daju značajni doprinos ukupnom privrednom razvoju zemlje. Takvi sektori se mogu smatrati najpogodnijim za razvoj firmi. To ne znači da će svaka firma koja je deo sektora sa potencijalom zaista i biti uspešna i konkurentna na međunarodnom nivou. Ipak, prosečna firma ima veće šanse da uspe u okviru takvog sektora. Da li će neko preduzeće uspeti ili ne zavisi prvenstveno od pojedinačnih atributa samog tog preduzeća.
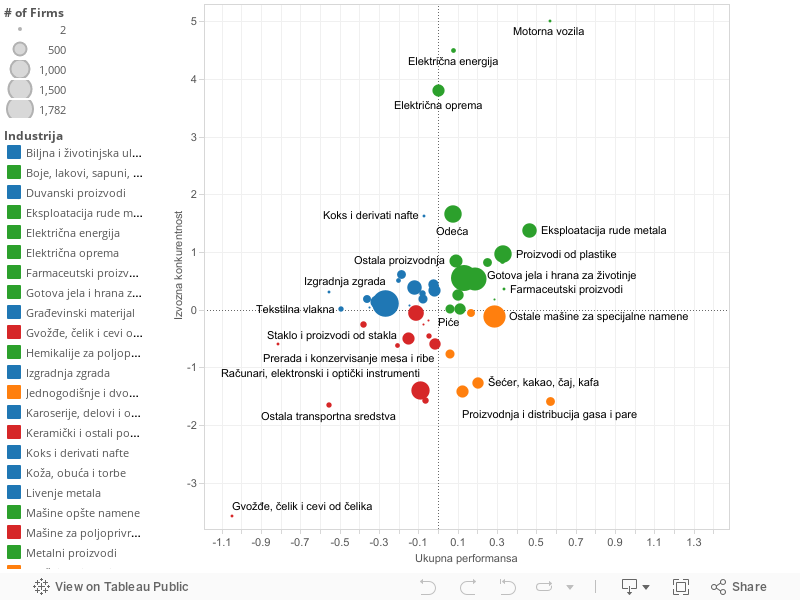
Matrica performanse i konkurentnosti, predstavljena na grafiku ispod, pruža uporedni pregled sektora na osnovu njihovih osobina i strukture međunarodne konkurentnosti i performanse u celini. Na njoj je prikazana raspodela 53 razmenljiva sektora na osnovu performanse u celini i izvozne konkurentnosti. Svaki sektor predstavljen je krugom, a veličina kruga ukazuje na broj firmi koje posluju u tom sektoru. Što više firmi posluje u tom sektoru, to je krug veći. Kvadrant I sastoji se od 18 sektora koji imaju i potencijal na globalnom nivou i dobru performansu. Ovi sektori su postigli pozitivnu izvoznu konkurentnost i ukupnu performansu u petogodišnjem periodu od početka krize 2009. do 2013. godine. Ovaj kvadrant očigledno predstavlja poželjnu lokaciju za svaki sektor. Sektori navedeni u ovom kvadrantu mogu se u ovom trenutku smatrati „zvezdama“ srpske privrede. Svaki treći (18 od 53) posmatrani razmenljivi sektor lociran je u ovom kvadrantu, što znači da su proizvodi ovih sektora konkurentni na velikoj većini stranih tržišta, dok je performansa ovih sektora relativno visoka.
Grafik – Performansa po sektorima (2009-2013)