FDI are significant for developing countries, as they are expected to provide the country with access to new technologies and knowledge, in addition to employment. In Serbia, they account for 10% of employment, which is significant for Serbia, but considerably less than the average. Central and Eastern Europe. FDI are often attracted by various types of incentives, which are paid as compensation for an underdeveloped business environment, but often also as a consequence of mutual competition between similar countries. With its attraction policy after 2009, Serbia has mainly attracted FDI of lower technological level and expected development effects, which was somewhat forced, but the situation has been improving recently.
This text is part of the project ’Alignment with EU Competition Policies’, implemented by CEVES with the financial support of the Embassy of the Kingdom of Norway in Belgrade and the Balkan Fund for Democracy of the German Marshall Fund of the United States. The views expressed in this publication do not necessarily represent the opinion of the Embassy of the Kingdom of Norway in Belgrade, the Balkan Fund for Democracy of the German Marshall Fund of the United States, or their partners.
The importance of FDI for developing countries (and Serbia)
Foreign direct investment is significant on several levels. To begin with, FDI inflows largely cover Serbia's trade deficit and balance its payment balance (in the period 2016-2018, they covered about 80% of the trade deficit). Without foreign currency inflows, Serbia's foreign exchange reserves could be quickly depleted, leading to a significant weakening of the dinar. Of course, the effect on public employment is more visible to the public, and it has been very significant in Serbia, as more than 250,000 people worked in foreign-owned companies in Serbia in 2016, and there are indications that the employment trend has accelerated further in the last two years. Created employment, through wages, stimulates local demand, which was particularly important for less developed regions. In addition to these more easily observable effects, theory suggests that foreign companies bring new knowledge, technologies, and “teach“ local economies new business management processes by connecting with local companies and creating a pool of skilled labor. However, the analysis of these “subtler“ effects requires special attention, as their fulfillment depends on a multitude of factors – in short, the type and technology of the investment and the capacities provided by the local environment into which the investment comes.
Why do we subsidize investors?
Although economists are divided on whether it is economically justified for the state to provide incentives to foreign investors or not, the fact is that all European countries rely on incentives, and even states within the USA, when competing with each other to attract a certain investment. Incentives for foreign investors are most often given in the form of various subsidies and tax reliefs. They can largely be considered as compensation for a poor business environment, i.e., underdeveloped infrastructure and institutions, potential macroeconomic risks (inflation, exchange rate, political changes), and an educational system that does not produce enough quality personnel. However, the situation where the state only compensates for the listed shortcomings with generous incentives, without doing enough to improve them, is counterproductive (and potentially dangerous). The process of attracting investors itself resembles a kind of auction, where countries, in addition to the environment they offer, add incentives of various intensities. Thus, it happens that countries with a poorer environment, wanting to attract a certain investor, are often too generous with incentives (overpay) and bear the winner's curse.
How many employees are in FDI?
Employment in FDI in Serbia is significant (about 10% of total employment in 2006), but still lower than in CEE countries (20% on average). Of the 250,000 employed, 160,000 relate to new investments, while the rest are in privatized companies that are foreign-owned. Privatization has indeed played a major role in “saving“ and revitalizing capacities from the past, but due to the specifics of the privatization program (which can be analyzed separately), as well as the fact that it did not generate de facto new employment, it will not be the subject of this discussion. The “remaining employment“ was created in new (greenfield) companies. In the mid-2000s, foreign companies often came to Serbia wanting to conquer the domestic market, such as large consulting or trading companies. The promotion of foreign investors began in 2006, but the incentives in the early years were still often directed at privatized companies. A turning point occurred in 2009-2010 when a new law regulating the attraction of foreign companies came into force – the Law on State Aid Control. At the same time, Serbia was facing high unemployment, especially in less developed, somewhat neglected regions. Largely as a result of the subsidy policy, between 2009 and 2016, companies were attracted that created about 50,000 jobs.
What is the structure of FDI attracted after 2009?
FDI that came in the period 2009-2016 created about 50,000 jobs. Of these, about 40,000 were created in the tradable goods and services sector, which were more likely to be subsidized, as can be concluded from the criteria and regulations prescribed by the Law and the Decree on State Aid. FDI that entered before 2009 also often received incentives to expand their business, but we will not focus on them here.
However, it is difficult to precisely determine the number of jobs created directly as a result of incentives, largely for two reasons. The first is the fact that some investors might have come even if no incentives were paid out, and the second is that data on recipients of state aid was often not sufficiently transparent and complete. Admittedly, our experience from conversations with foreign investors suggests that the number of those who would have come without incentives is likely small. Moreover, some investors claim that they would have expanded their business more slowly if they were not obligated by contract with the state to hire faster. Also, both transparency and data availability have been improving since 2016. Nevertheless, our analyses indicate that out of 40,000 jobs created in the tradable goods and services sector, 70-80% are in companies that received some form of incentive. It can also be concluded that companies with over 500 employees almost always received incentives, but as the size of the company decreases, the probability that these companies were recipients of incentives decreases, and the availability of reliable data also decreases.
In order to somehow assess the developmental effects of attracted FDIs, we divide them into four “ideal types“ according to the type and method of production – which largely determine their developmental effects. Also, our analysis indicates that FDI types can be linked to the average wage level paid in them, so type 1 is grouped at a wage level that is about 75% below the national average, type 2 around the average, type 3 25% above the average, while type 4 includes companies with wages twice the average.
Type 1 FDIs can best be described as mostly large companies engaged in mass production of very simple products with low added value. Approximately half of the employees in the period 2009-2016 belong to this category (almost 20,000 employees). Examples of these companies include those producing cables for the automotive industry, seat covers, and sewing and knitting of other textile products. The product characteristics are entirely determined by the parent company, leaving no room for potential improvements and creativity. Work tasks are mostly repetitive, so in these companies, low-skilled workers constitute 70-80% of the total workforce. Consequently, the scope for internal advancement or acquiring new skills for these workers is relatively limited – therefore, universally employable human capital is not created in these companies. Due to mass production and high input standards, connections with domestic suppliers are mostly limited to cleaning, security, and sometimes technical maintenance services. However, since such companies mostly came to less developed regions, their effect on local income and demand was not negligible. However, the question arises what will happen to these companies when wages in Serbia rise,
Type 2 FDIs are also mostly large, and most often belong to the automotive industry. However, they produce slightly more complex products, such as plastic interior parts for cars, electric motors, hydraulic systems, or (simpler) small household appliances. Slightly more than 25% of employees in the period 2009-2016 belong to this category. The slightly more complex production requires the presence of a somewhat skilled workforce (minimum 20-30%), and all workers also have a higher chance of internal advancement and training (a relatively stronger effect on human capital). Also, some of these companies started as companies that could be classified as type 1, but improved their production over time. These FDIs also played a significant role in “saving“ remaining engineering capacities. However, connections with domestic suppliers are relatively weak in this type as well, for similar reasons as in the previous one.
Type 3 FDIs represent a heterogeneous group of producers of products and services with higher added value. In FDIs established in the period 2009-2016, about 15% of employment belongs to this category (about 6,000 employees). Companies from the service sector mainly provide professional services (technical support), but their complexity and added value have been increasing recently. Thus, companies that started predominantly as call centers, are now thinking in the direction of Industry 4.0 – robotics and automation. This group also includes a group of smaller companies engaged in somewhat simpler IT programming (e.g., web design). In the manufacturing sector, these are mostly companies in the machine and metal industry that produce more complex products, often customized to customer needs. Companies of this type bring truly new technologies into the economy and create a layer of highly qualified workforce that drives long-term sustainable economic growth and development.
Type 4 FDIs are mostly smaller companies belonging to creative industries with high added value, such as IT, pharmaceuticals, logistics, and similar high-tech services. In the period from 2009-2016, employment in them increased the least (they constitute less than 10% of employees in that period). Employees in them are generally highly qualified, and their skills are further improved through work. Such firms do not necessarily have an effect on the economy through the inclusion of suppliers in their value chains, but rather by improving the productivity of the entire economy by offering it their solutions (services). Also, a very significant effect is the creation of a pool of highly qualified labor that is scarce and desirable not only in Serbia but also globally.
In the period 2009-2016, an increasing trend in the share of the workforce in type 1 and 2 companies is observed compared to the previous period (Graph). Such an increase can be explained by the fact that these investments arrived in the less developed regions of southern and eastern Serbia. However, the slow growth of employment in types 3 and 4 is difficult to explain, as it might be expected that companies that arrived earlier would produce a spiral attracting similar companies. However, in a way, it is also proof that such companies react less to incentives (subsidies), while the business environment in a broader sense in Serbia has not advanced enough. However, somewhat fresher evidence indicates that the structure of attracting investors has recently improved (Continental and Essex have signed agreements committing to pay salaries of 1,500 and 900 euros).
Chart: Employment and wages in FDI by year of entry, by type[1]
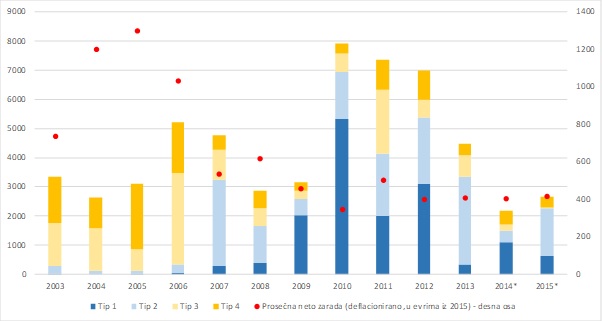
[1] Values for employment and wages were taken three years after entry, meaning we wanted to show the status of companies after the initial investment cycle was completed.
* denotes years with less than three years of lag – 2014 and 2015, as we only have comparable data up to 2016.