

Diversification shows the degree to which an industry achieves expansive and far-reaching export competitiveness. Industries with a relatively high degree of diversification evidently possess the capabilities to produce a wide range of products that are demanded in a variety of markets. In this sense, such industries show the ability to accommodate customers with different needs, values, and cultures. Diversification encompasses product diversification and market diversification. The degree of an industry’s diversification in both these aspects indicates how comprehensive its competitiveness is. Product diversification represents the level of product variety that makes up the export basket of an industry, while market diversification refers to the number of foreign markets to which that industry exports. In other words, it indicates whether a given industry is capable of producing different products that are in demand in different markets.
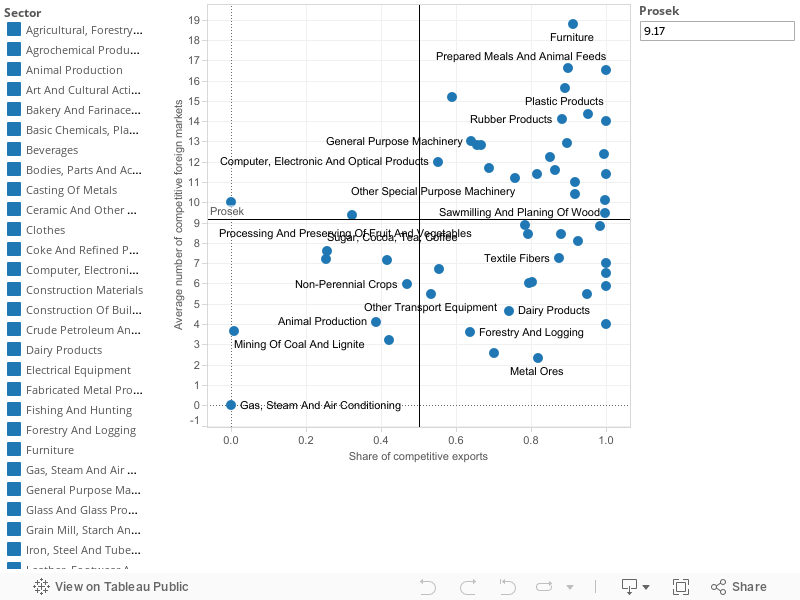
The most successful industries in terms of export diversification are those that produce and sell a greater number of competitive products in the most diverse foreign markets. The leading industries we identified through the diversification analysis are the manufacture of prepared meals and animal feed, the manufacture of agricultural chemicals, and the manufacture of furniture, etc. On the other hand, the least diversified industries are the manufacture and distribution of gas and steam and air conditioning, the exploitation of coal and lignite, the manufacture of bakery and pasta products, and the exploitation of metal ores. These industries have not shown the capacity for diversification, both in terms of exported products and export destinations. Industries are distributed according to the number of markets in which they demonstrate competitive advantage and the share of exports of competitive products in the total export value of each industry. The vertical and horizontal lines intersecting this figure represent the average values of each indicator. Thus, industries are classified into four quadrants according to the number of markets in which they have improved their positions and according to the degree of product participation in that improvement.
Graph – Export diversification of industries (2009-2013)
Diversification shows the degree to which an industry achieves expansive and far-reaching export competitiveness. Industries with a relatively high degree of diversification evidently possess the capabilities to produce a wide range of products that are demanded in a variety of markets. In this sense, such industries show the ability to accommodate customers with different needs, values, and cultures. Diversification encompasses product diversification and market diversification. The degree of an industry’s diversification in both these aspects indicates how comprehensive its competitiveness is. Product diversification represents the level of product variety that makes up the export basket of an industry, while market diversification refers to the number of foreign markets to which that industry exports. In other words, it indicates whether a given industry is capable of producing different products that are in demand in different markets.
The most successful industries in terms of export diversification are those that produce and sell a greater number of competitive products in the most diverse foreign markets. The leading industries we identified through the diversification analysis are the manufacture of prepared meals and animal feed, the manufacture of agricultural chemicals, and the manufacture of furniture, etc. On the other hand, the least diversified industries are the manufacture and distribution of gas and steam and air conditioning, the exploitation of coal and lignite, the manufacture of bakery and pasta products, and the exploitation of metal ores. These industries have not shown the capacity for diversification, both in terms of exported products and export destinations. Industries are distributed according to the number of markets in which they demonstrate competitive advantage and the share of exports of competitive products in the total export value of each industry. The vertical and horizontal lines intersecting this figure represent the average values of each indicator. Thus, industries are classified into four quadrants according to the number of markets in which they have improved their positions and according to the degree of product participation in that improvement.
Graph – Export diversification of industries (2009-2013)